

Important: This news article was created by LiteM Life Testing Machines, who have kindly given AML Instruments permission to publish it on our site. Full credits for the analysis can be found at the bottom of the page.
A study was conducted to evaluate the adhesion of Carbon and Kevlar reinforcements applied to PETG sheets. This material is commonly used in the manufacturing of orthopedic braces; however, it presents several critical issues, primarily related to durability and comfort. These braces often experience premature failures, which compromise the longevity of the device. The use of reinforcement patches could, on one hand, improve resistance to early damage, and on the other, enhance user comfort by allowing the use of thinner PETG sheets. This is made possible through the localised application of reinforcements in the most critical areas.
Goal: Verify that the adhesive DP490 employed to attach Carbon and Kevlar reinforcement patches onto PETG beams endures repeated cyclic loading, thereby confirming its suitability for everyday use in orthopedic brace applications.
Method: to evaluate the performance of the adhesive used to bond the reinforced patches onto the PETG specimens, a durability test under force control was carried out through cyclic loading using a three-point bending (3PB) setup. Two specimens were tested: the first consisted of a 3 mm thick PETG sample with two-layer carbon fiber reinforcement patches bonded to both ends (resulting in a total thickness of 5.25 mm), and the second consisted of a 3 mm thick PETG sample with two-layer Kevlar reinforcement patches bonded to both ends (resulting in a total thickness of 4.8 mm), both specimens were 130 mm long and the adhesive was left to cure for 16 hours. The specimens were clamped at both ends and at the center, with the central clamp acting as the movable grip.
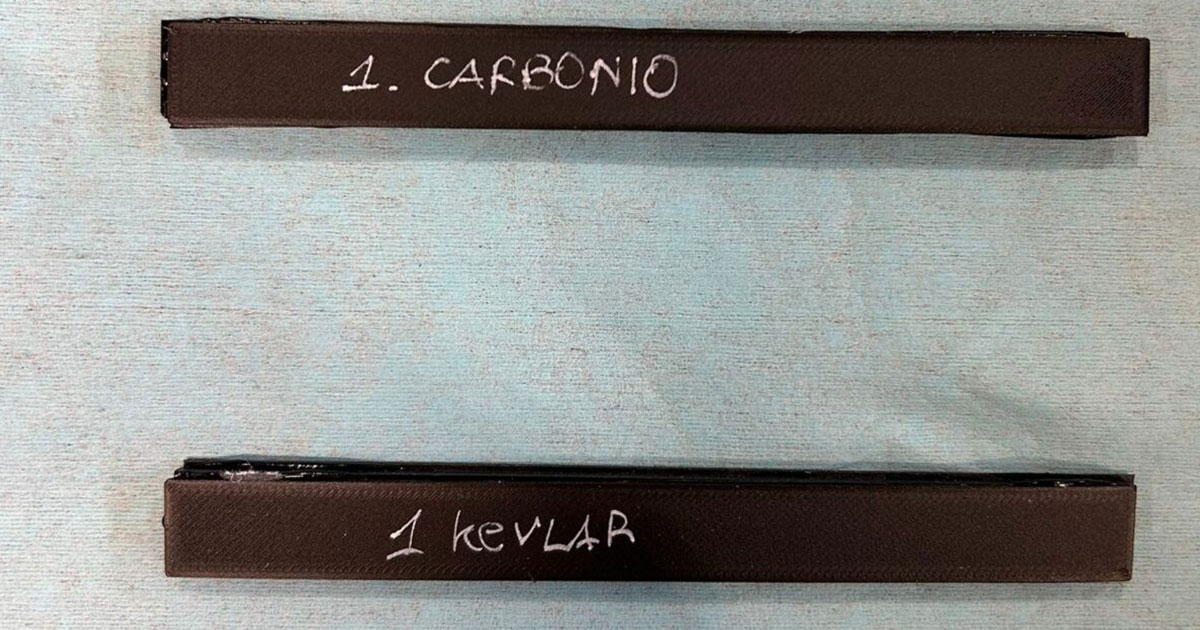
Two flat composite bars labelled “Carbonio” and “Kevlar,” shown intact before testing.
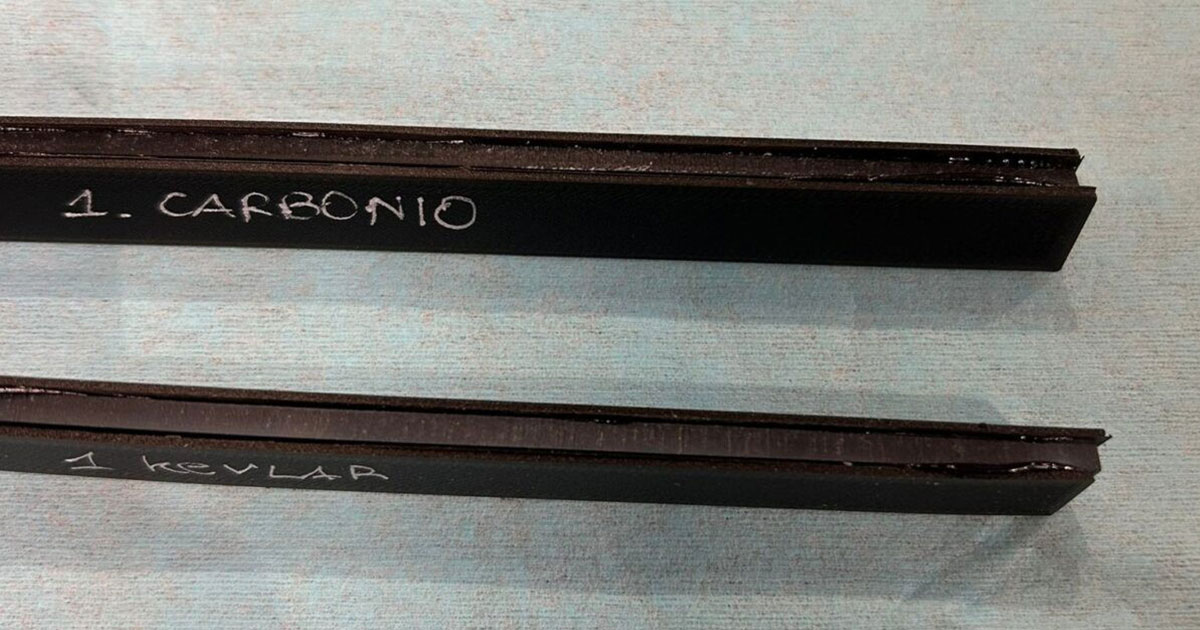
Carbon fibre and Kevlar bars after breaking.
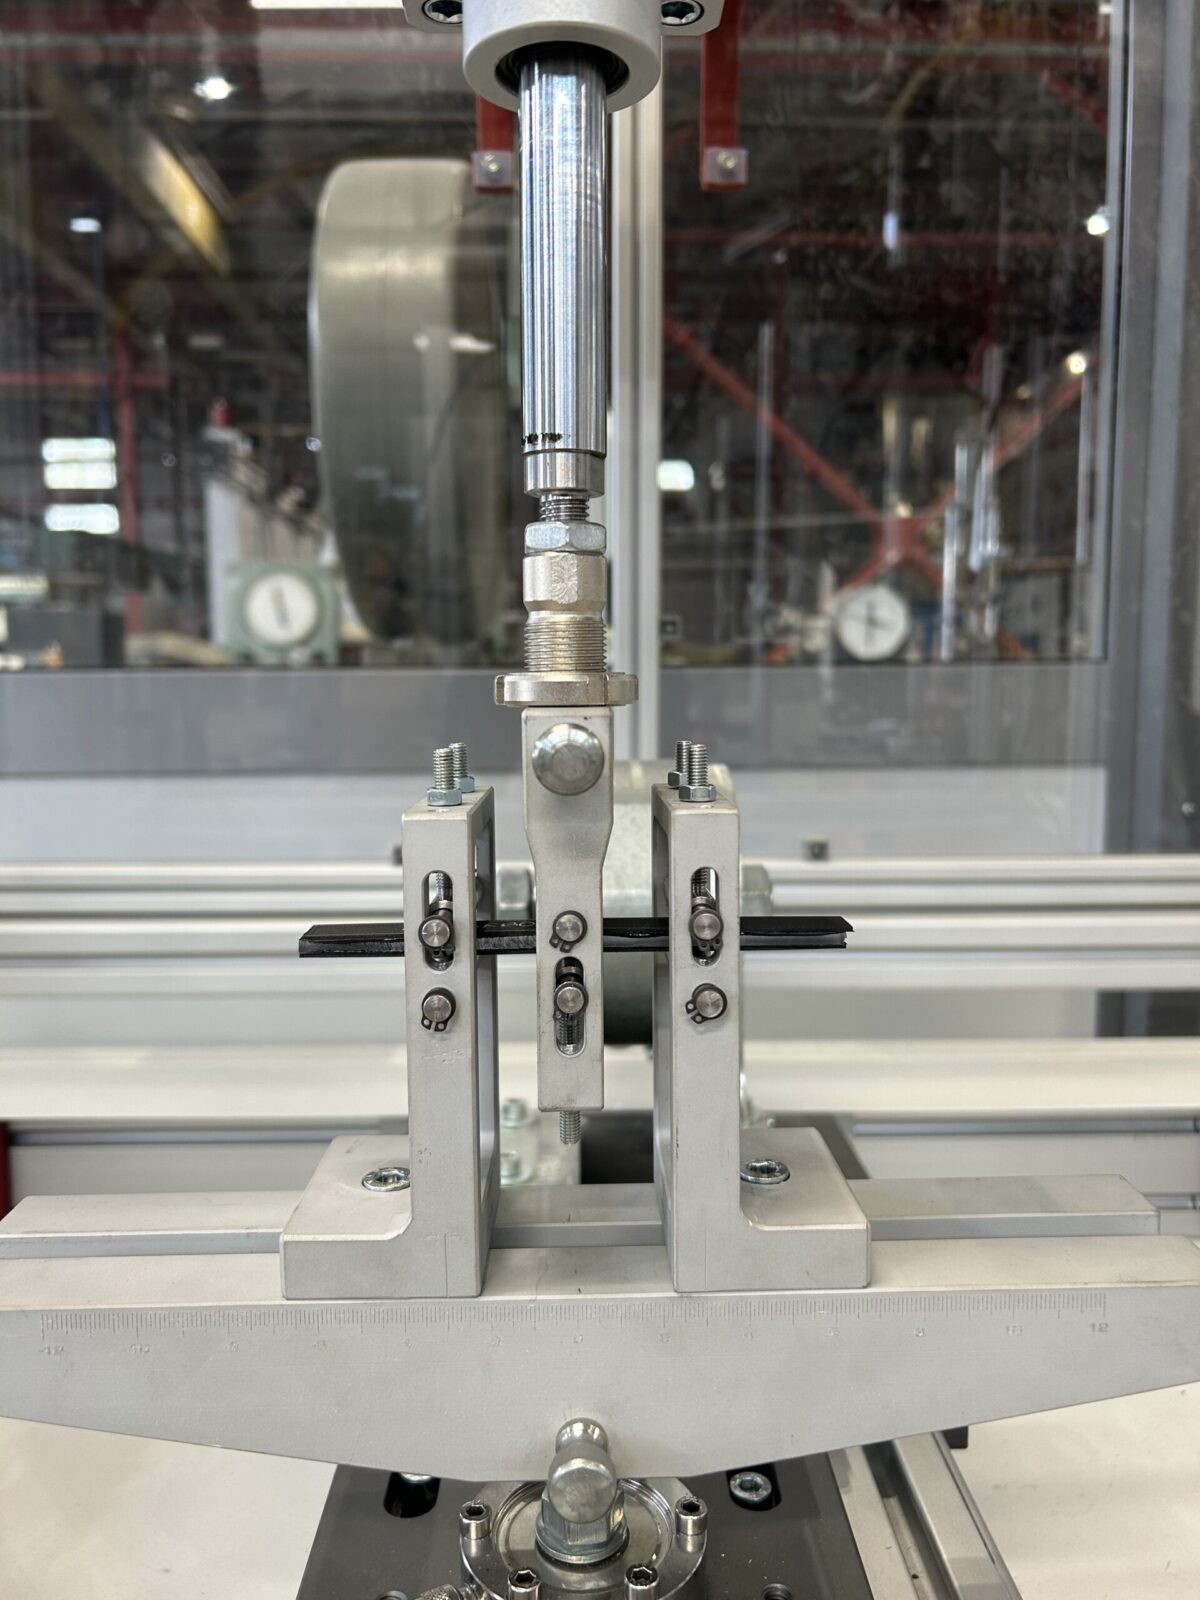
Carbon-reinforced sample test set-up.
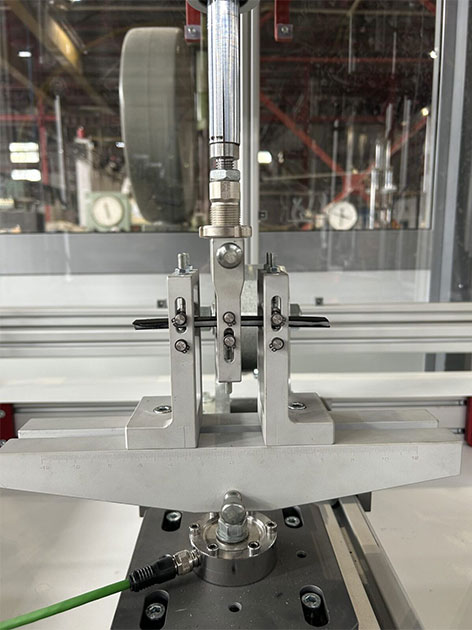
Kevlar-reinforced sample test set-up.
The specimens were subjected to a maximum number of 50’000 loading cycles at a frequency of 5 Hz. As a preliminary analysis, to determine the range of maximum and minimum forces for the test, three-point bending displacement controlled tests were conducted on similar specimens (figure 3 and 4).
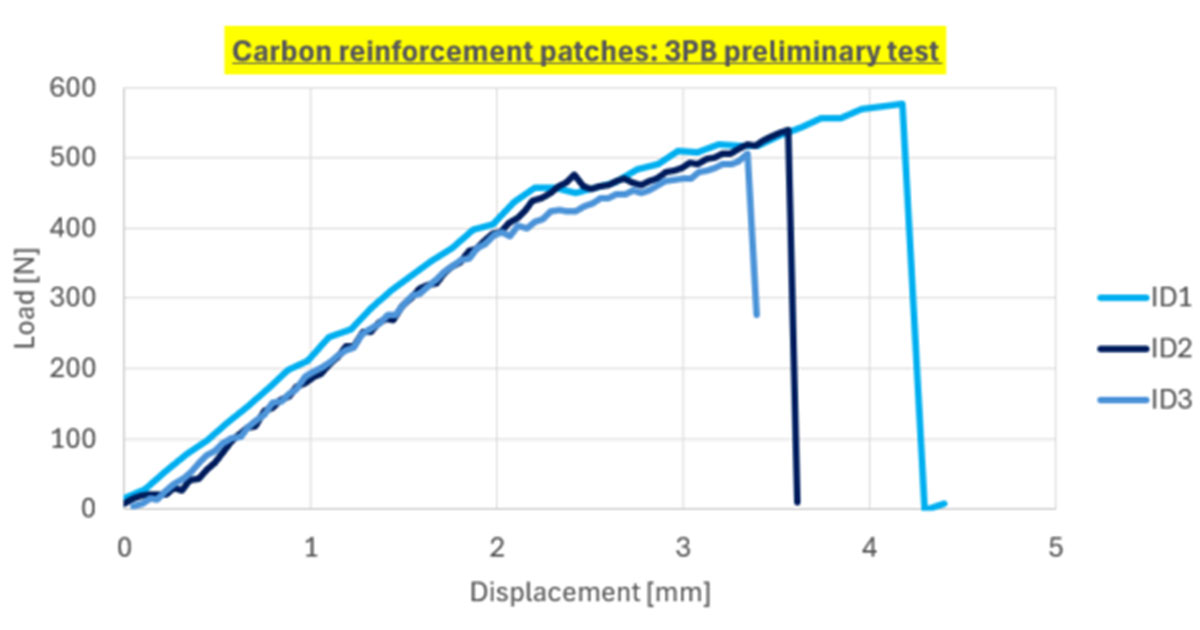
Load versus displacement curves for three carbon-reinforced samples in a three-point bending test, showing steep load increase up to about 550 N followed by sudden drops indicating brittle failure.
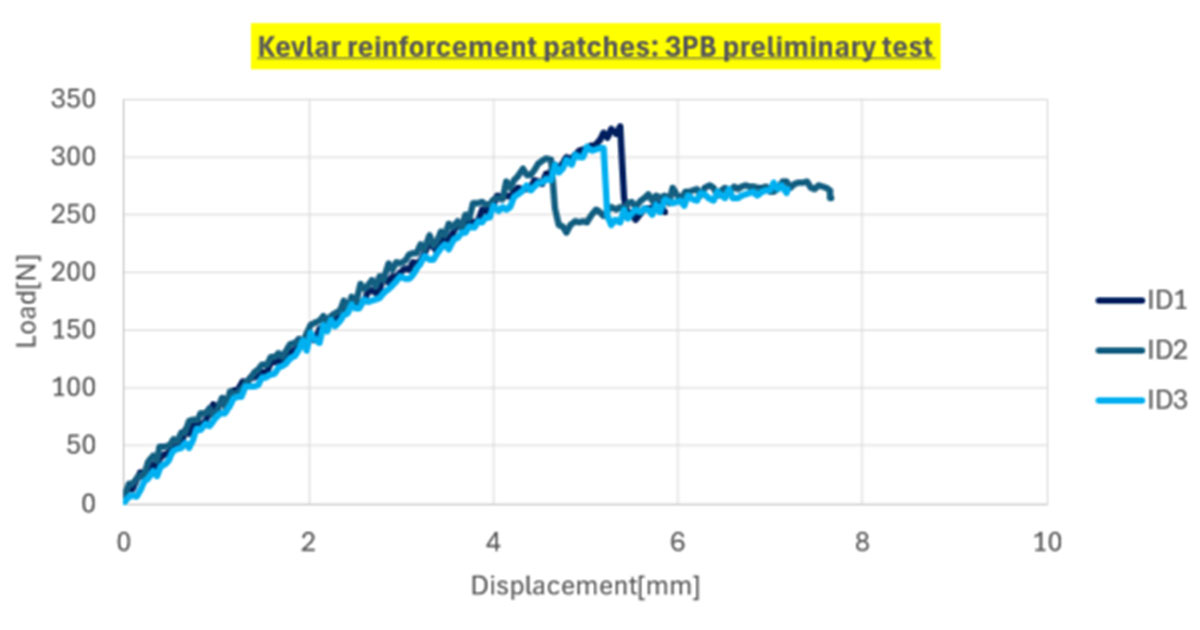
Load versus displacement curves for three Kevlar-reinforced samples in a three-point bending test, showing increasing load up to about 300 N followed by drops indicating failure and partial recovery.
The maximum and minimum loads of the cycle were chosen to be equal to half of the force required to reach the lowest yield strength among the materials constituting the laminate, in order to simulate realistic yet non-destructive operating conditions. Following these considerations, the maximum and minimum forces for the specimen reinforced with Carbon fibre patches were found to be ±110.5 N, and for those reinforced with Kevlar patches ±61.6 N.
Results: An analysis of the maximum and minimum displacement as a function of the applied loading cycles showed that these values remained constant throughout the entire test. This outcome confirms the durability of both the materials and the bonding system under cyclic loading conditions.
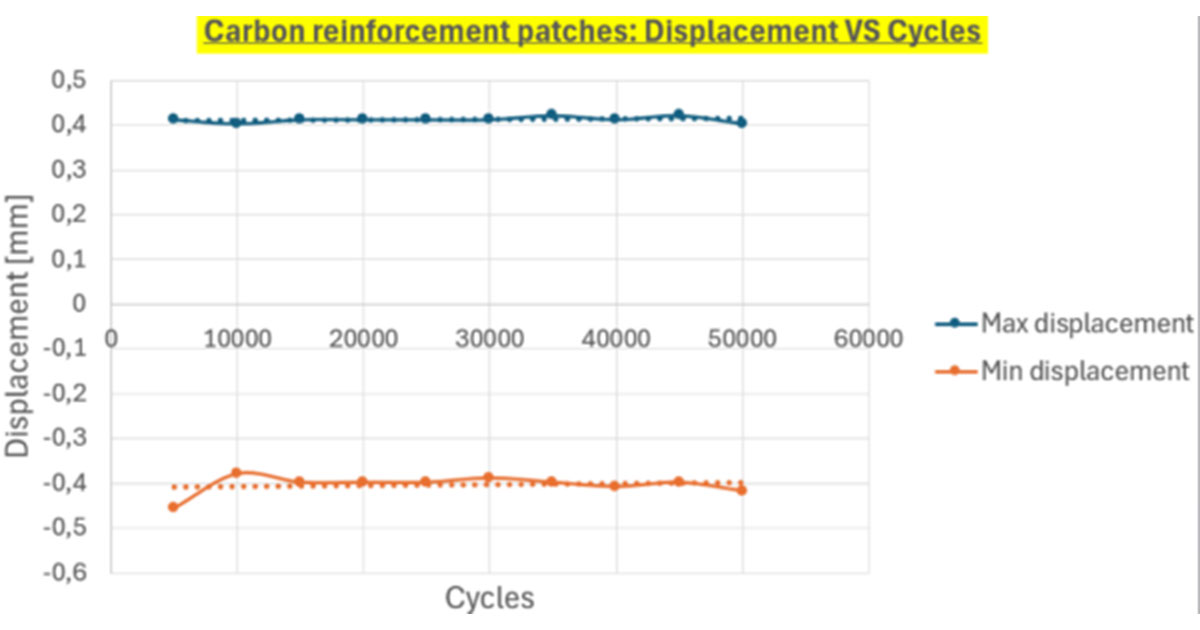
Line graph of displacement versus cycles for carbon reinforcement patches, showing stable maximum displacement around 0.4 mm and minimum displacement around -0.4 mm across 50,000 cycles.
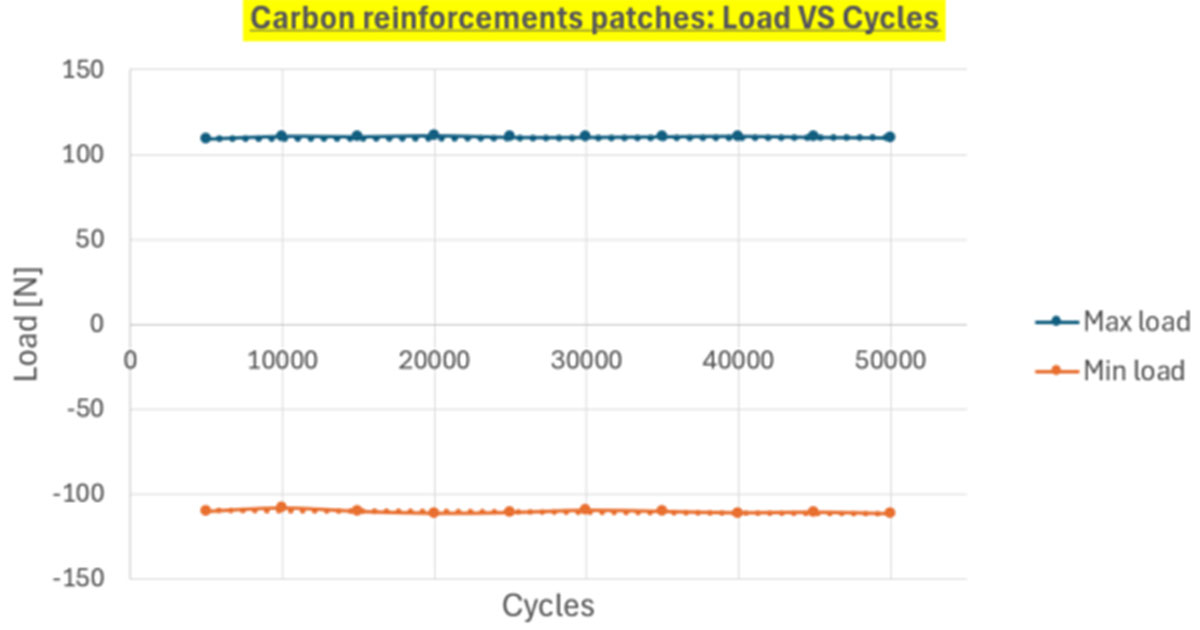
Line graph of load versus cycles for carbon reinforcement patches, with consistent maximum load near 110 N and minimum load near -110 N across 50,000 cycles.
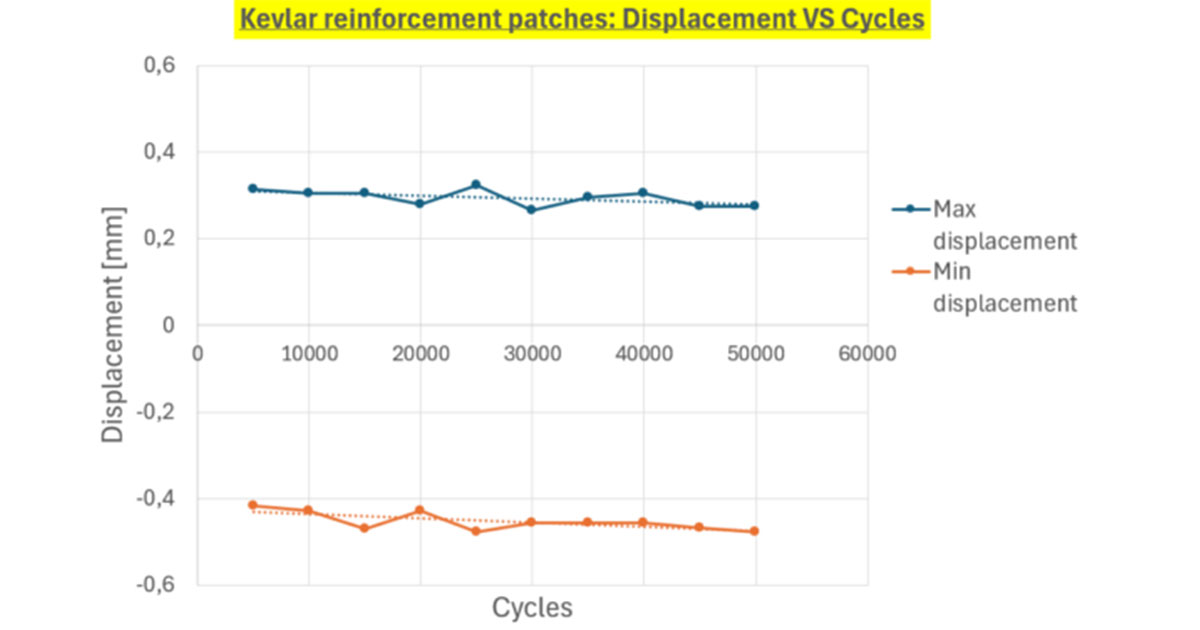
Line graph of displacement versus cycles for Kevlar reinforcement patches, showing slightly fluctuating maximum displacement around 0.3 mm and minimum displacement near -0.5 mm over 50,000 cycles.
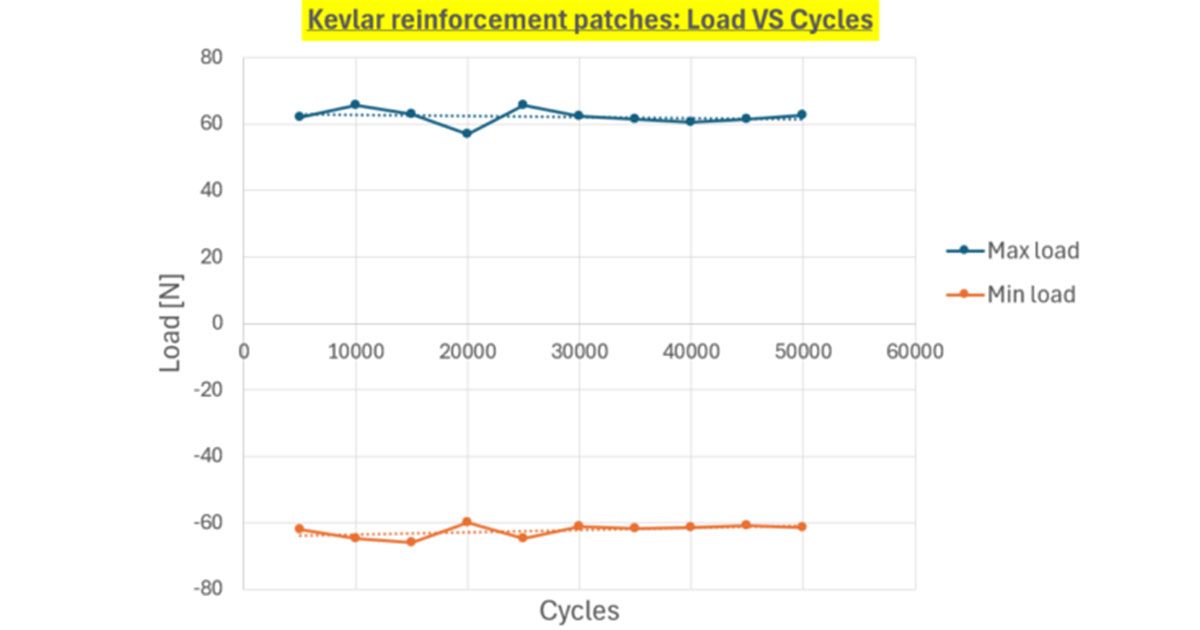
Line graph of load versus cycles for Kevlar reinforcement patches, with maximum load around 60–65 N and minimum load near -60 N, showing slight variations over time.
Credits: The analysis was performed by G. Francabandiera under the supervision of B. Rossetti, using the Litem BYC 200 machine available at the Department of Civil Engineering and Architecture (DICAR) at the University of Pavia. The research activity was coordinated by G. Alaimo, S. Marconi, and F. Auricchio.


